ORGANIZATIONAL STRUCTURE & UTILIZATION | 2024
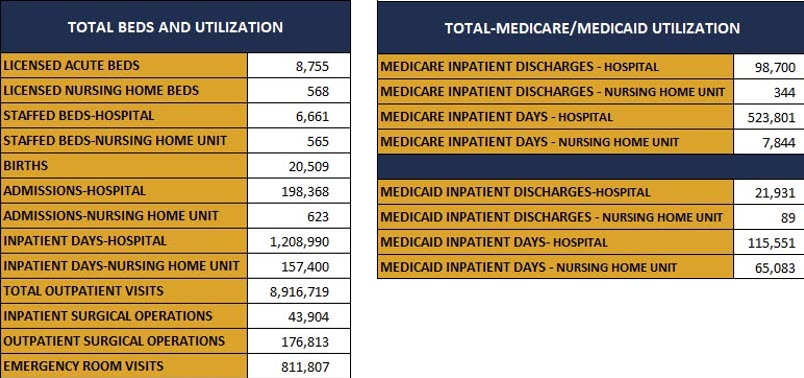
SOURCE: American Hospital Association Annual Survey, collected 2025 - 112 Hospitals Included
UTILIZATION AND FINANCE TRENDS | 2020-2024
Kansas Hospitals
Utilization of Kansas hospital services and financial trends.
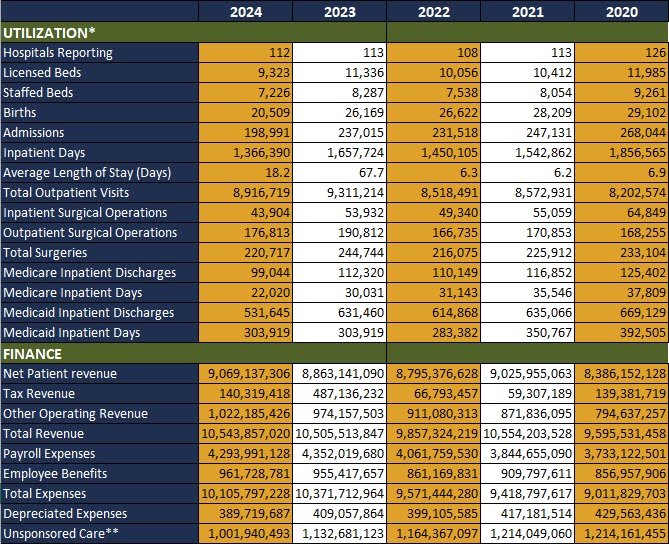
**Unsponsored Care = Bad debt + charity care.
NOTE : Numbers may not add to totals because of rounding. Includes hospital-owned acute care and nursing home data. Beds are total for facilities,
SOURCE: Kansas Hospital Association, 2024 American Hospital Association Annual Survey, collected 2025
COMMUNITY HOSPITAL UTILIZATION TRENDS | 2018-2023
Statewide utilization for Kansas community hospitals remain relatively constant. The data provided below reports the number of discharges, inpatient days and average length of stay according to patient age and geographical location of community hospitals.
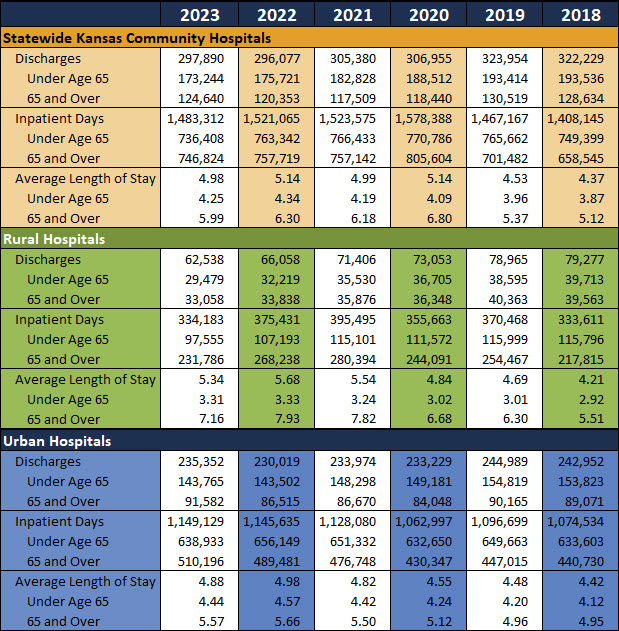
NOTE: Data are based upon Federal Fiscal Year (October - September)
SOURCE: Kansas Hospital Association FFY2023 Inpatient Data